The question
I drive a Chevy Bolt and wanted two straightforward answers: how much does it actually cost to charge at home, and am I charging in a way that minimizes that cost?
I already had granular consumption data from our Enphase solar system so the hard part wasn't getting data, it was pulling the charger out of everything else we were doing in the house.
What the data showed
Once I looked at whole-home consumption, EV charging was easily the largest single load. It was bigger than our 3 kW AC and bigger than our 3 kW electric dryer. That intuitively made sense but seeing it on a chart made it feel doable.
The next question was practical: with Claude's help, how hard would it be to isolate those charging sessions from the rest of the signal? And the answer was: surprisingly easy.
Finding charging sessions
I took the baseline home energy usage, then looked for sustained spikes where the charger was pulling roughly 7 kW watts continuous from our 32A charger. That signature was easy enough to pull sessions out of the noise without hand-labeling.
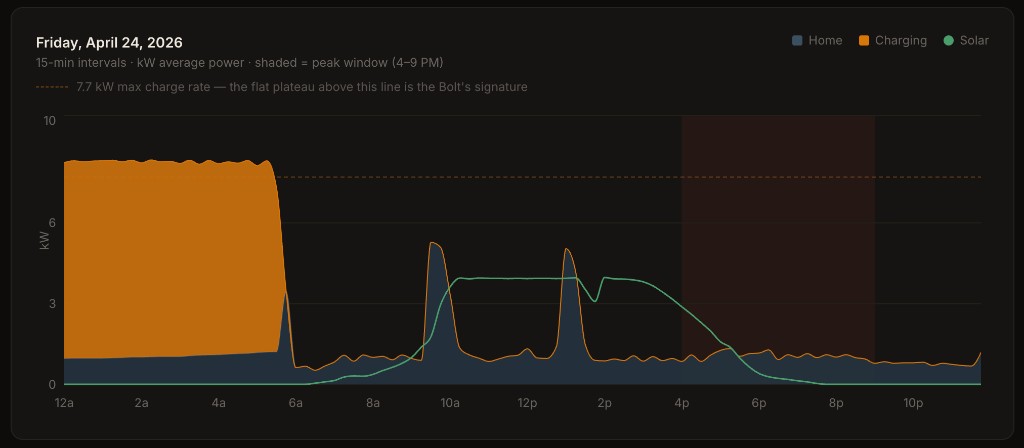
A typical overnight session — the flat orange plateau above the 7.7 kW line is the Bolt's charging signature, distinct from baseline home load and daytime solar.
Validation
I validated the method against two sources of truth: ChargePoint EVSE session data for home charging (this was a recent install, otherwise some questions would have been pretty easy to answer), and PG&E meter data over the same period.
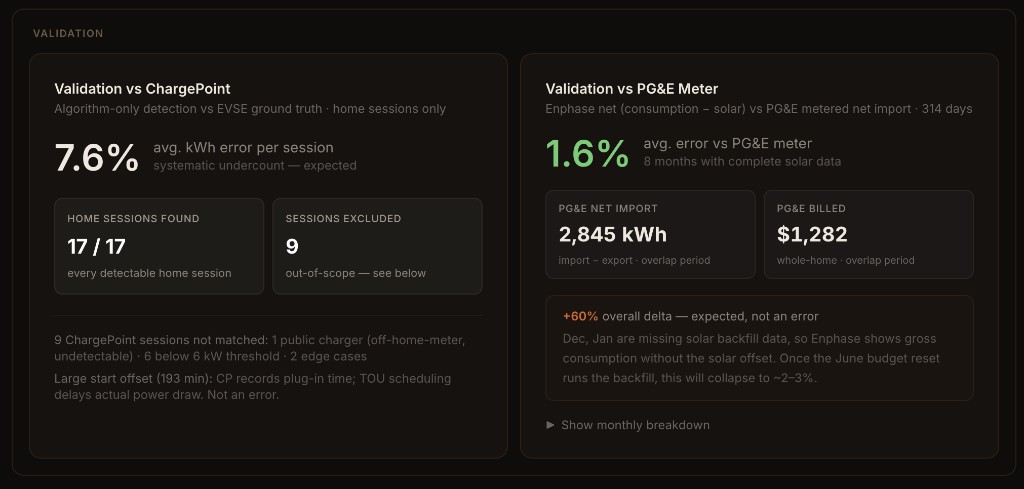
Left: algorithm-only detection vs ChargePoint ground truth — 17/17 home sessions found, ~7.6% avg kWh error (systematic undercount from TOU scheduling delay between plug-in and actual draw). Right: Enphase net vs PG&E metered import — 1.6% avg error over 314 days with complete solar data.
Once the pipeline worked, I could answer the original cost question. That's where things got more interesting.
Where it got more interesting (i.e. complicated)
The rate kept moving.
My first answer was something like "about $0.35/kWh" because that's what an old YAML I had said off-peak was. Then I pulled an actual bill and realized summer off-peak is $0.49, not $0.35. Headline jumped to $0.45. Then I added the baseline credit and it dropped to $0.36. Then I sanity-checked that against the per-month effective rates and the math didn't reconcile. Tightened that, $0.35. Then I realized in some summer months EV was effectively offset by solar exports and dropped it to $0.29. Then bills came in and pulled it back up to $0.39.
Each rate move was something I'd missed:
- The basic-electric vs all-electric distinction — we have gas appliances, so our baseline allowance is 9.7 kWh/day not 14.6
- NEM2.0 vs NEM3.0 — we're grandfathered on 2.0, which means solar exports get credited at retail TOU rate, not the ~$0.08 avoided cost. That fact decides whether daytime self-consumption matters for charging strategy (it doesn't for us but would for anyone on 3.0)
- The marginal-load assumption — I'd assumed EV always pays full off-peak rate because non-EV consumption alone exceeds baseline. That's true on gross consumption but PG&E bills on net. With solar, non-EV net is often well under baseline even in winter for our small home, so EV is actually what pushes us above. EV gets partial credit on the boundary kWh
- The annual true-up — for months when I'm a net exporter, the credit doesn't vanish. It accumulates and offsets future bills at retail rate. So EV charging in a net-export month isn't "free" — it's eating credit that would have offset later imports
What the bills caught
Three actual PG&E bills, each from a different "state" of the household:
- September (below baseline, summer): model matched within 0.1%. ✓
- January (above baseline, winter): model was 10% high. The marginal-load assumption was wrong for winter once you account for solar offsetting non-EV consumption
- July (net exporter): model said $0 cost. Bill showed −$19.60 (a credit). Without the EV, the credit would've been ~$53 bigger. So July EV charging really cost ~$53, paid as reduced credit balance rather than cash
Each bill caught a different model bug. The bills also gave me the rate structure ground truth for PCE generation, baseline credit per kWh, NBC adjustments which I'd been approximating before.
The anchor
End state: about $0.39/kWh average across the year, ~$1,130 annual cost, ~$249 cheaper than gas at 30 MPG (at least with 2025 gas prices). Not the dramatic savings story I'd expected, but real and bill-validated.
A solid baseline mattered more than the exact number. I had no mental model for what charging costs really were except the published on-peak vs. off-peak rates. That makes "shopping around" at public chargers hard when most people don't know there are effectively two tiers for slow home charging at one or two rates, and fast DC charging at another. Different speeds, different prices, hard to compare at the station. Now my wife and I have a shared baseline: about $0.39/kWh at home in summer, $0.43 in winter, and a much clearer picture of what a session anywhere else actually costs us.
What I learned
Write down your assumptions as you go. I started an ASSUMPTIONS.md partway through and it ended up being the most useful artifact of the whole project. Not for sharing — for me. Every time a number moved or a model changed, I'd update the doc. By the time I got to the third bill validation, I could trace exactly which assumption it had broken and why. If I pick this up again in six months I'll know what state we left things in, which open questions are still open, and which dead ends I already explored. The file is messy and won't be read by anyone but me, but I'd start one earlier next time.
Validate against multiple ground truths. No single source was sufficient. ChargePoint told me whether I'd correctly identified sessions but not what they cost only because it was a recent install. PG&E Green Button confirmed the kWh totals matched the meter but said nothing about the cost model. The actual bills validated the cost model but only after I had everything else nailed down. Each layer caught different errors. A model that "looks right" against one ground truth can still be quietly wrong against another.
Working with Claude is a thought-partnership, not delegation. This is the part I underestimated going in. Claude is fast and patient and will happily produce a confident answer to almost anything. The risk is that confidence reads as correctness, and you start trusting outputs you haven't really inspected. The discipline I had to develop:
- Poke when something doesn't look right. When the headline rate dropped from $0.45 to $0.29 in one change, that was too good and I made it stop and explain. That's how we caught the lost-export-credit problem.
- Ask it to explain its work. Not "is this right?" — explanations dodge that by sounding plausible. Better: "walk me through what this would do for July specifically" with numbers I could check.
- Cross-check against the real world. Bills, not synthetic tests.
- Push back on confident answers in ambiguous territory. At one point it told me I should switch to EV2-A rate plan. I almost did — until I asked it to think about how that would affect my solar export credits and the math completely flipped.
Human judgment still wins, but the iteration speed is awesome. A change that would've been an evening's project — refactor the cost model, update three components to use shared logic, regenerate the data, verify the build — was 15 minutes of back-and-forth. The flip side is that pace makes it really easy to stop reading carefully.
Simple questions hide complicated answers. "How much does it cost to charge at home?" sounds like a one-line answer. By the end I had four cost figures (raw billed, corrected, true economic, marginal session rate), three bill validations, two rate plans modeled, and an annotated assumptions doc. I don't regret any of the depth but I noticed how easily a project like this could've ended at "$0.45/kWh, cool" and just been wrong. Although now I'm at $0.39/kWh so it wasn't far off but it's the journey right?
BoltMeter is live. Check out the full analysis at boltmeter.starterlabs.ai.